Python Doesn't Need To Be Slow: From 405s to 0.06s with N-Body Simulations 🚀


Python is the lingua franca of Data Science and AI, beloved for its readability and massive ecosystem. But let’s address the elephant in the room: Python can be slow.
We often hear "loops are slow" or "use vectorization," but how much difference does it actually make? Can we make Python compete with C++ or Rust? In this study, we explored exactly that by benchmarking the classic N-Body simulation across a variety of Python accelerators and native languages.
The results were startling: we achieved a 6000x speedup by moving from standard Python to a CUDA C++ implementation, and a 260x speedup staying purely within the Python ecosystem (thanks to Numba).
🐢 Motivation: Why is Python Slow?
Python is an interpreted, dynamically typed language. When you write a + b, the interpreter has to inspect the types of a and b, dispatch the correct addition method, and create a new object for the result. This overhead is negligible for a few operations but becomes catastrophic in tight loops involving millions of calculations.
Additionally, the Global Interpreter Lock (GIL) prevents standard Python from utilizing multiple CPU cores for CPU-bound tasks, leaving your powerful multi-core processor mostly idle.
📢 News Flash (Python 3.13+): As of Python 3.13, Experimental "Free-Threading" (PEP 703) is essentially removing the GIL! This means a future where standard Python threads usually run in parallel is on the horizon. However, for now, the GIL is still the default reality for most users.
🌌 The Problem: N-Body Simulation
To test our optimizations, we used the N-Body Simulation. It calculates the gravitational forces between N bodies in massive space.
Why this problem?
- Computational Expense: The naive algorithm is
O(N^2). Every body interacts with every other body. Doubling the bodies means quadrupling the work. - CPU Bound: It’s pure math-heavy calculation, perfect for stressing the interpreter.
- Parallelizable: It’s an "embarrassingly parallel" problem, making it ideal for testing multi-core and GPU acceleration.
For our benchmarks, we used N=5000 bodies, which requires 25 million interactions per time step.
🛠️ The Method: Contenders
We implemented the simulation using three categories of tools:
The Standard Library:
- Vanilla Python: Pure lists and loops. The baseline.
- Multiprocessing: Spawning separate processes to bypass the GIL.
The Accelerators (Python-based):
- NumPy: Vectorized operations in C.
- Cython / MyPyc: Compiling Python to C extensions.
- JIT Compilers (Numba, PyPy, JAX, Taichi): Compiling code to machine instructions at runtime.
The "Speed Limit" (Native & GPU):
- Rust: A modern systems programming language (running natively).
- CUDA C++: Explicit GPU programming on NVIDIA hardware.
- CUDA Python: Using Python bindings to write CUDA kernels.
📊 Findings & Contribution
We ran the simulation for 100 steps with N=5000 using Python 3.11. Here is what we found:
1. The "Need for Speed" Tier (GPU) ⚡
The absolute winner was CUDA C++, clocking in at 0.06 seconds. Surprisingly, CUDA Python was not far behind at 0.64 seconds. This shows you can access near-native GPU power without leaving Python syntax, provided you write kernel code.
2. The "Free Lunch" Tier (JIT) 🏎️
If you don't have a GPU or want to stay on the CPU, Numba and Taichi were the champions.
- Numba: 1.54s
- Taichi: 1.62s
This is a massive ~260x speedup over Vanilla Python (405s). Numba achieved this with just a simple @njit(parallel=True) decorator. It effectively beat our single-threaded Rust reference implementation (~7.7s) by leveraging automatic parallelization on the CPU.
⚖️ A Note on Fairness: You might wonder why Numba beat Rust. Our Rust and C++ implementations are deliberately kept single-threaded to represent "basic, native performance" — the kind you get from writing standard serial code without complex parallel logic. Numba, however, unlocks multi-core Parallelism with a single flag. A parallelized Rust implementation (e.g. using
rayon) would certainly be faster, but the Comparison highlights how accessible high performance is in Python today.
3. The "Solid Effort" Tier 🚜
- JAX: ~7.3s (Great for gradients, decent for pure sim)
- Cython: ~7.3s
- PyPy: ~11.7s
- MyPyc: ~11.9s
These provided significant improvements (30-50x speedups) but lagged behind the specialized JIT compilers for this specific numerical task.
4. The Baseline 🐌
- Vanilla Python: 404.9 seconds.
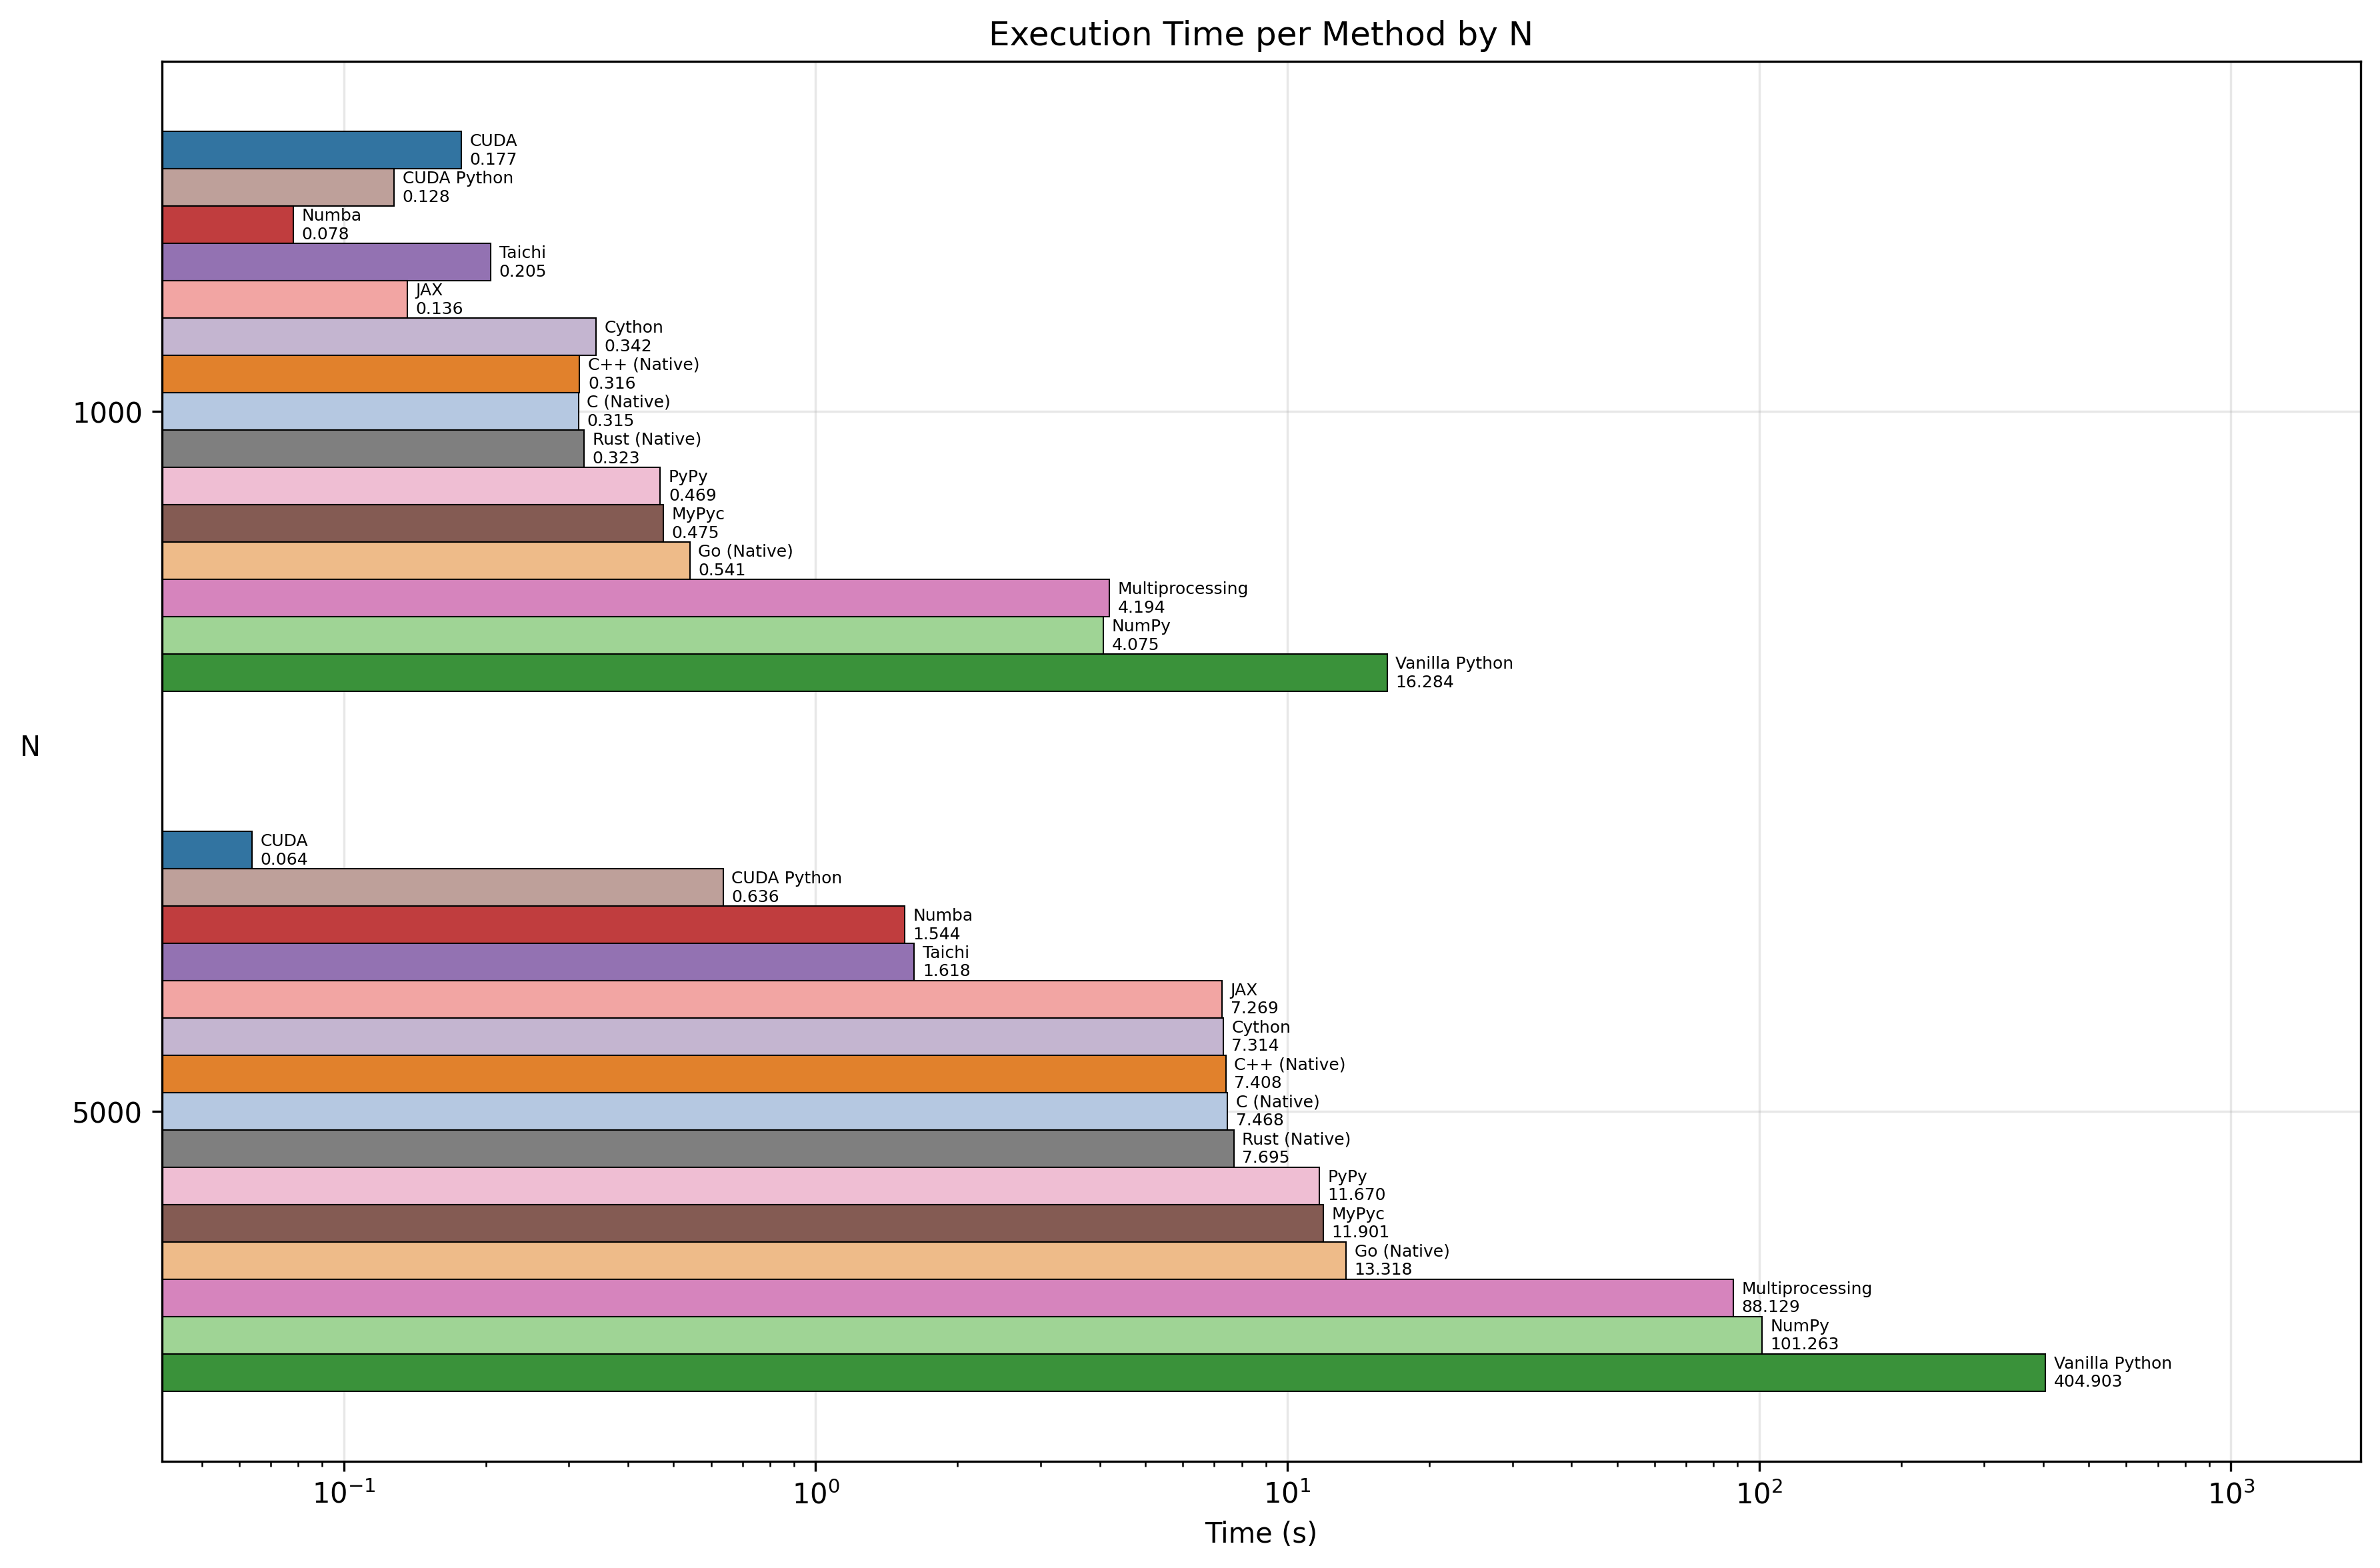
Visualizing the Speed 📈
Here is a look at the raw execution times. Note how the optimized implementations barely register on the chart compared to Vanilla Python!
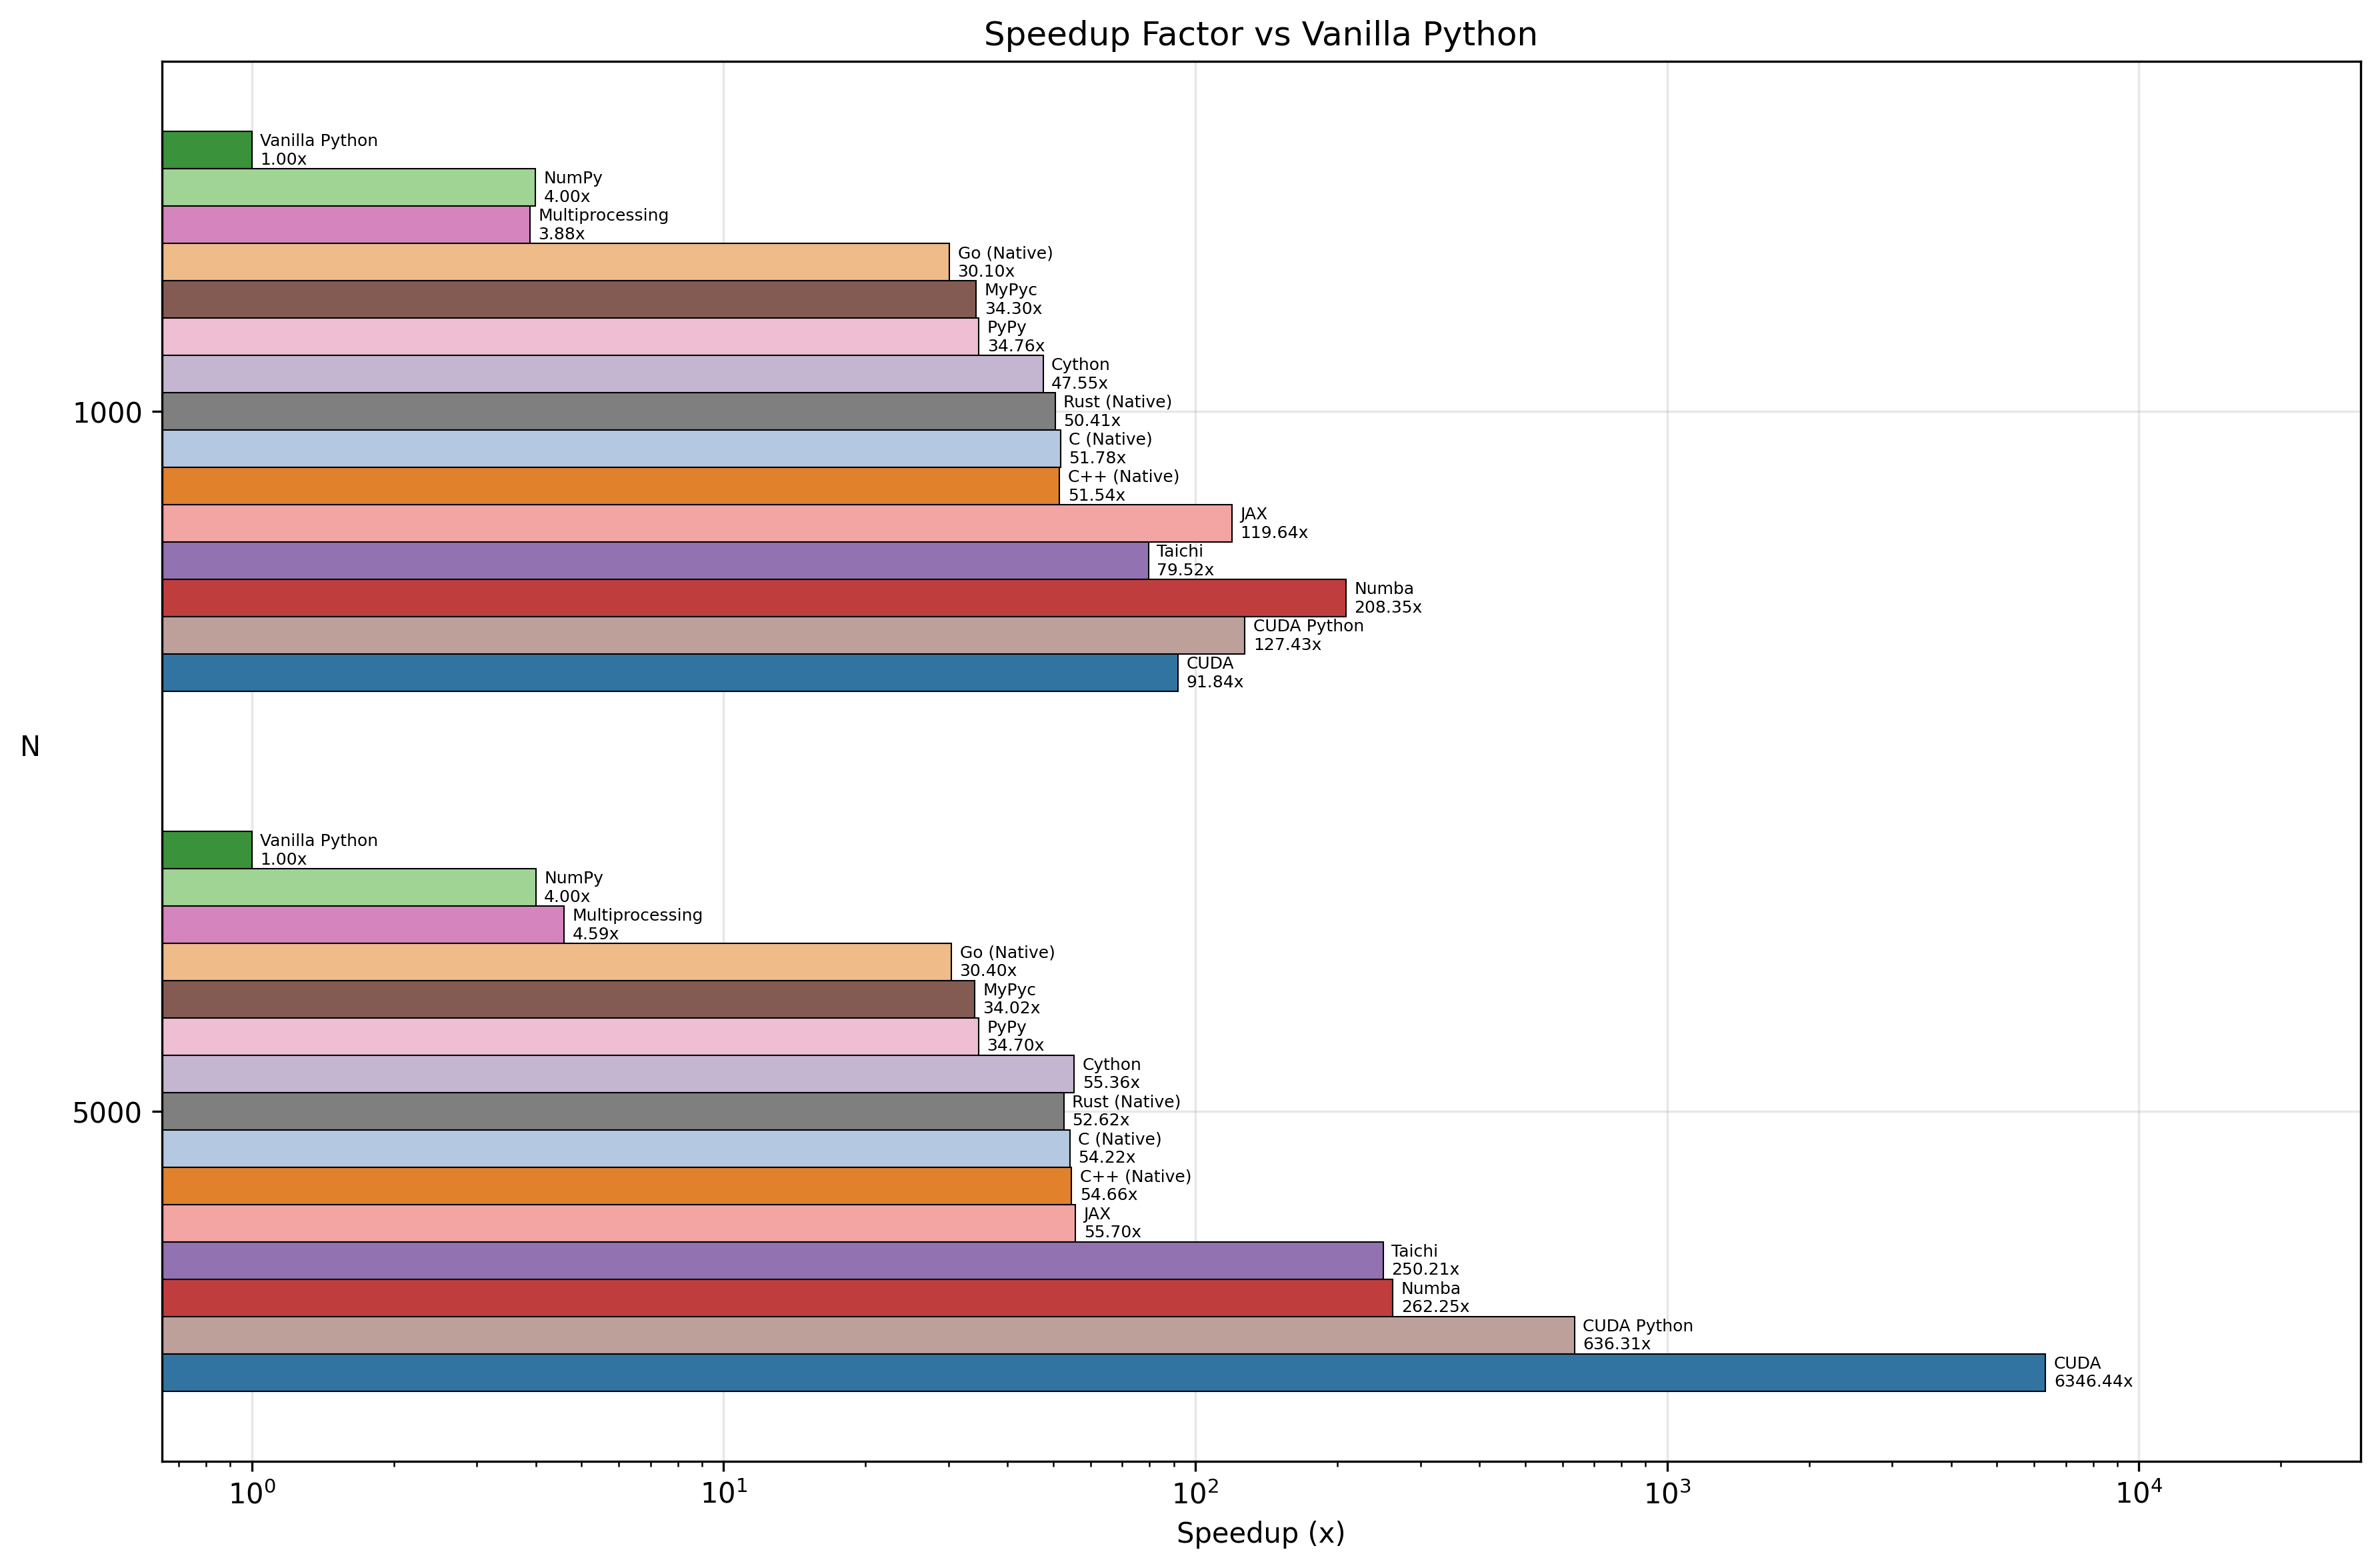
And here is the speedup factor, showing just how much faster each method is compared to the baseline:
Summary Table (N=5000)
| Implementation | Time (s) | Speedup vs Vanilla |
|---|---|---|
| CUDA C++ | 0.06s | ~6346x |
| CUDA Python | 0.64s | ~632x |
| Numba | 1.54s | ~262x |
| Taichi | 1.62s | ~250x |
| Rust (Native) | 7.70s | ~52x |
| Cython | 7.31s | ~55x |
| PyPy | 11.67s | ~35x |
| Vanilla Python | 404.90s | 1x |
🏁 Conclusion
The notion that "Python is slow" is a half-truth. While pure Python is slow (O(N^2) loops are painful), the Python Ecosystem is incredibly fast.
- For pure raw speed, nothing beats dedicated hardware (GPU/CUDA).
- For the best effort-to-performance ratio, tools like Numba and Taichi are astounding. You can get 200x+ speedups with minimal code changes, often outperforming serial implementations in languages like C++ or Rust.
- Know your tools: Use NumPy for vectorization, Numba for loops, and CUDA for massive parallelism.
Python doesn't have to be slow; you just have to know which pedal to push.
Check out the full code and reproduce the benchmarks here: github.com/atasoglu/Python-doesnt-need-to-be-slow
Reference Video: https://www.youtube.com/watch?v=umLZphwA-dw